Control valves
Pressure reducing/surplussing valves
0.3
0.4
3
0.5 0.6 0.7 0.8 0.9 1.0 1.1
➤
1.2
9
1.3
11
Upstream pressure bar g
(x 100 = kPa)
14
5
7
1.4 1.5 1.6 1.7
0.4
0.6 0.8
1.0
1.2
1.4 1.6 1. 8
2.0 2.2 2.4
2.6
2.8 3.0
4.6.19
ISO 9001
TI-P001-09
CH Issue 2
Cert. No. LRQ 0963008
12
11
10
9
8
7
6
5
4
3
2
1
0
0 0.1 0.2
1⁄2" - DN15
LRV2
Pressure Reducing Valve
Capacities
Water capacities in metric units
Capacity
litres/s
0 0.2
0 0.2 0.4 0.6 0.8 1.0 1.2 1.4 1.6 1.8 2.0 2.2 2.4 2.6 2.8 3.0 3.2 3.4 3.6 3.8 4.0 1"-DN25
3⁄4" - DN20
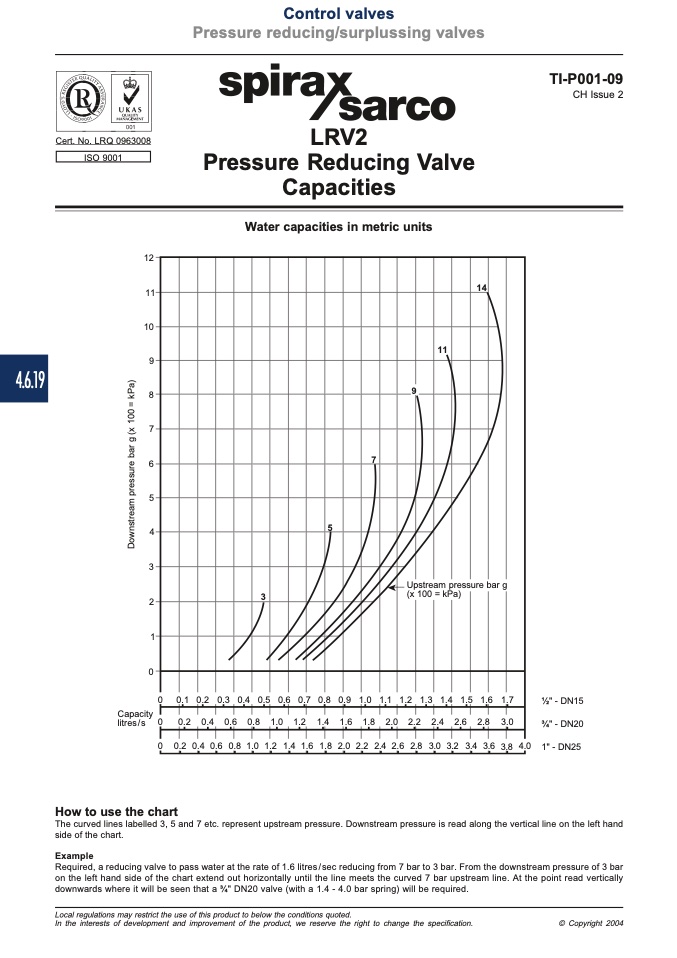
How to use the chart
The curved lines labelled 3, 5 and 7 etc. represent upstream pressure. Downstream pressure is read along the vertical line on the left hand
side of the chart.
Example
Required, a reducing valve to pass water at the rate of 1.6 litres/sec reducing from 7 bar to 3 bar. From the downstream pressure of 3 bar
on the left hand side of the chart extend out horizontally until the line meets the curved 7 bar upstream line. At the point read vertically
downwards where it will be seen that a 3⁄4" DN20 valve (with a 1.4 - 4.0 bar spring) will be required.
Local regulations may restrict the use of this product to below the conditions quoted.
In the interests of development and improvement of the product, we reserve the right to change the specification.
© Copyright 2004
D
o
w
n
s
t
r
e
a
m
p
r
e
s
s
u
r
e
b
a
r
g
(
x
1
0
0
=
k
P
a
)

