Flowmetering
Target flowmeters
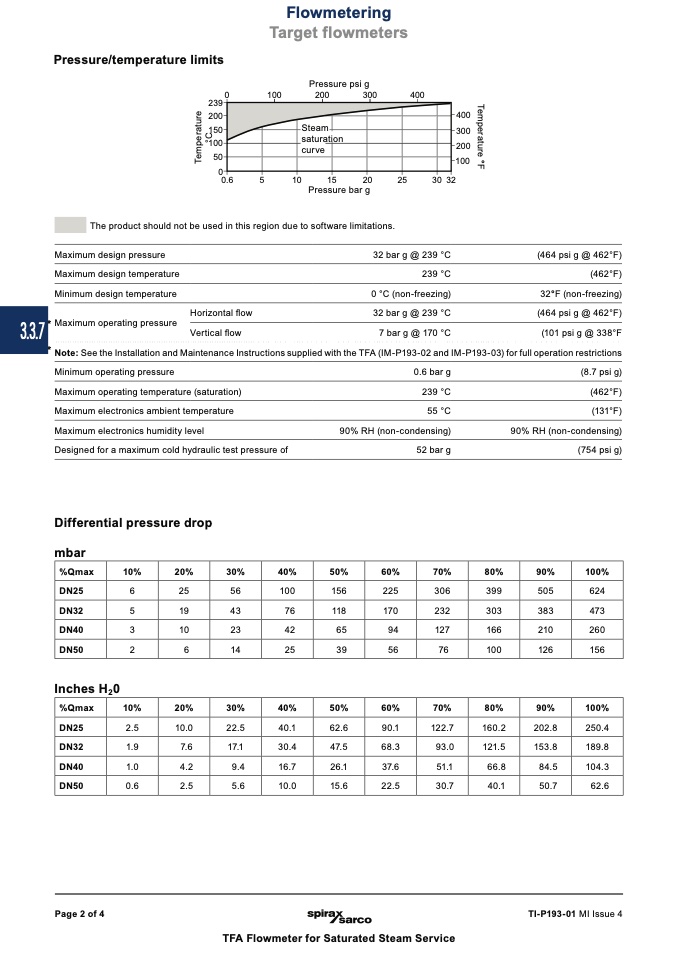
Pressure/temperature limits
239
0
200
150
100
50
100
200
300
400
Pressure psi g
Steam
saturation
curve
400
300
200
100
0
0.6
5
10
15
20
25
3032
Pressure bar g
The product should not be used in this region due to software limitations.
Maximum design pressure
Maximum design temperature
Minimum design temperature
3.3.7
* Maximum operating pressure
* Note: See the Installation and Maintenance Instructions supplied with the TFA (IM-P193-02 and IM-P193-03) for full operation restrictions
Horizontal flow
32 bar g @ 239 °C
239 °C
0 °C (non-freezing)
32 bar g @ 239 °C
(464 psi g @ 462°F)
(462°F)
32°F (non-freezing)
(464 psi g @ 462°F)
Vertical flow
7 bar g @ 170 °C
(101 psi g @ 338°F
Minimum operating pressure
Maximum operating temperature (saturation)
Maximum electronics ambient temperature
Maximum electronics humidity level
Designed for a maximum cold hydraulic test pressure of
Differential pressure drop
mbar
Inches H
2
0
0.6 bar g
239 °C
55 °C
90% RH (non-condensing)
52 bar g
(8.7 psi g)
(462°F)
(131°F)
90% RH (non-condensing)
(754 psi g)
%Qmax
10% 20% 30%
40%
50%
60%
70% 80%
90%
100%
DN25
6 25 56
100
156
225
306 399
505
624
DN32
5 19 43
76
118
170
232 303
383
473
DN40
3 10 23
42
65
94
127 166
210
260
DN50
2 6 14
25
39
56
76 100
126
156
%Qmax 10%
20%
30% 40%
50%
60%
70%
80% 90% 100%
DN25 2.5
10.0
22.5 40.1
62.6
90.1
122.7
160.2 202.8 250.4
DN32 1.9
7.6
17.1 30.4
47.5
68.3
93.0
121.5 153.8 189.8
DN40 1.0
4.2
9.4 16.7
26.1
37.6
51.1
66.8 84.5 104.3
DN50 0.6
2.5
5.6 10.0
15.6
22.5
30.7
40.1 50.7 62.6
Page 2 of 4
TI-P193-01 MI Issue 4
TFA Flowmeter for Saturated Steam Service
T
e
m
p
e
r
a
t
u
r
e
°
F
T
e
m
p
e
r
a
t
u
r
e
°
C

