Control valves
Pressure reducing/surplussing valves
Page 3 of 4
2
3
4
5
6
7
8
Upstream pressure bar
(x 100 = kPa)
9
g
4.6.15
9
8
7
6
5
4
3
2
1
0
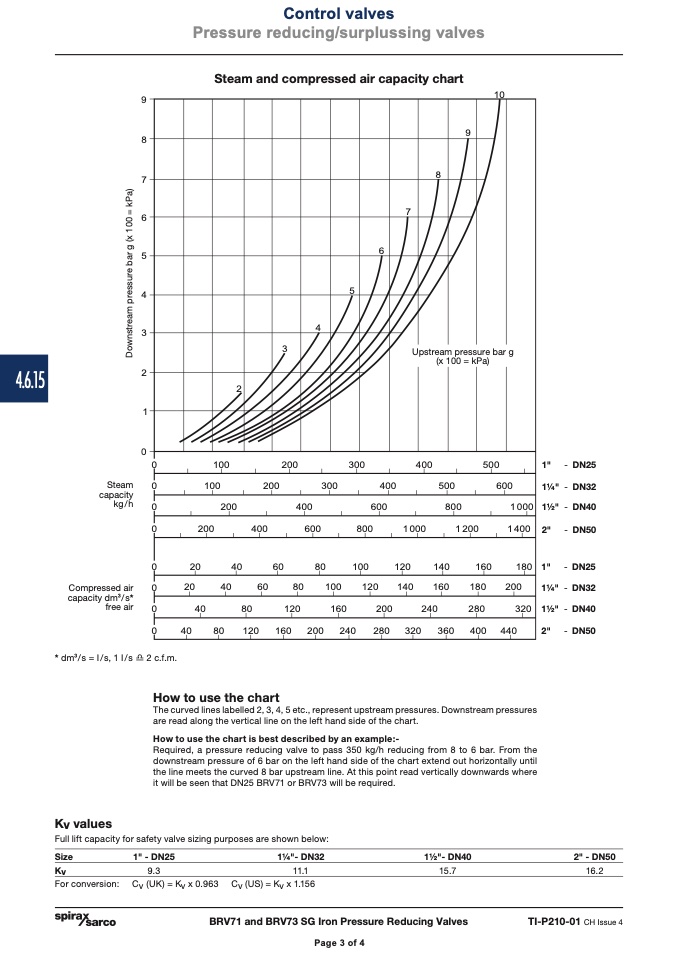
Steam and compressed air capacity chart
10
0
0
0
0
200
400
600
800
1000
1200
1400
Steam
capacity
kg/h
Compressed air
capacity dm
3
/s*
free air
300
400
500
500
600
1" - DN25
11⁄4" - DN32
11⁄2" - DN40
2" - DN50
1" - DN25
11⁄4" - DN32
11⁄2" - DN40
2" -DN50
100
100
200
200
400
300
400
600
800
200
1 000
20
40
60
80
100
120
140
160
180
20
40
60
80
100
120
140
160
180
200
0
0
0
40
80
120
160
200
240
280
320
0
40
80
120 160 200 240
280 320 360 400 440
* dm
3
/s = I/s, 1 I/s2 c.f.m.
How to use the chart
The curved lines labelled 2, 3, 4, 5 etc., represent upstream pressures. Downstream pressures
are read along the vertical line on the left hand side of the chart.
How to use the chart is best described by an example:-
Required, a pressure reducing valve to pass 350 kg/h reducing from 8 to 6 bar. From the
downstream pressure of 6 bar on the left hand side of the chart extend out horizontally until
the line meets the curved 8 bar upstream line. At this point read vertically downwards where
it will be seen that DN25 BRV71 or BRV73 will be required.
Kv values
Full lift capacity for safety valve sizing purposes are shown below:
Size
Kv
For conversion:
1" - DN25
9.3
Cv
v
(UK) = Kv x 0.963
11⁄4"- DN32
11.1
Cv (US) = Kv x 1.156
11⁄2"- DN40
15.7
2" - DN50
16.2
BRV71 and BRV73 SG Iron Pressure Reducing Valves
TI-P210-01 CH Issue 4
Page 3 of 4
D
o
w
n
s
t
r
e
a
m
p
r
e
s
s
u
r
e
b
a
r
g
(
x
1
0
0
=
k
P
a
)

