General information
Useful calculation data
Example 3
Example 1
Example 2
Example 4
11.5.11
ISO 9001
TI-GCM-11
CM Issue 1
Cert. No. LRQ 0963008
Condensate pipe sizing
Condensate pipes operate in 4 basic ways:
1. Drain lines to traps.
2. Discharge lines from traps.
3. Common discharge lines.
4. Pumped lines.
Types 2 and 3 will usually contain flash steam
whilst types 1 and 4 will not.
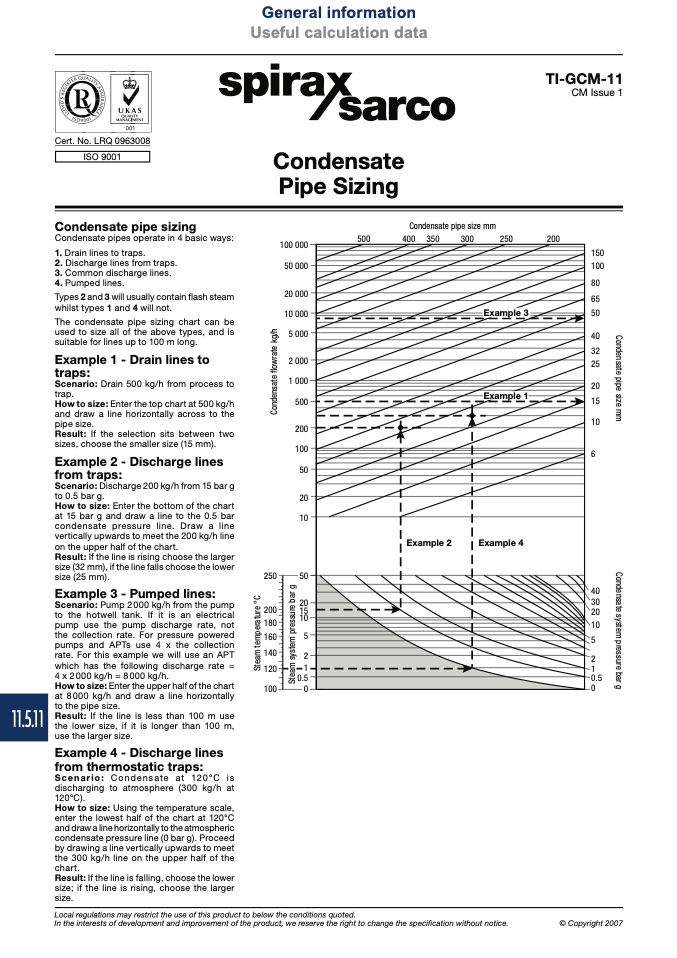
The condensate pipe sizing chart can be
used to size all of the above types, and is
suitable for lines up to 100 m long.
Example 1 - Drain lines to
traps:
Scenario: Drain 500 kg/h from process to
trap.
How to size: Enter the top chart at 500 kg/h
and draw a line horizontally across to the
pipe size.
Result: If the selection sits between two
sizes, choose the smaller size (15 mm).
Example 2 - Discharge lines
Condensate
Pipe Sizing
100 000
50 000
20 000
10 000
5 000
2 000
1 000
500
200
100
50
20
10
50
20
15
10
5
2
1
0.5
0
500
400
350
300
250
200
Condensate pipe size mm
from traps:
Scenario: Discharge 200 kg/h from 15 bar g
to 0.5 bar g.
How to size: Enter the bottom of the chart
at15barganddrawalinetothe0.5bar
condensate pressure line. Draw a line
vertically upwards to meet the 200 kg/h line
on the upper half of the chart.
Result: If the line is rising choose the larger
size (32 mm), if the line falls choose the lower
size (25 mm).
250
Example 3 - Pumped lines:
Scenario: Pump 2000 kg/h from the pump
to the hotwell tank. If it is an electrical
200
pump use the pump discharge rate, not
180
the collection rate. For pressure powered
160
pumps and APTs use 4 x the collection
140
rate. For this example we will use an APT
which has the following discharge rate =
120
4 x 2000 kg/h = 8000 kg/h.
How to size: Enter the upper half of the chart
100
at 8000 kg/h and draw a line horizontally
to the pipe size.
Result: If the line is less than 100 m use
the lower size, if it is longer than 100 m,
use the larger size.
Example 4 - Discharge lines
from thermostatic traps:
Scenario: Condensate at 120°C is
discharging to atmosphere (300 kg/h at
120°C).
How to size: Using the temperature scale,
enter the lowest half of the chart at 120°C
and draw a line horizontally to the atmospheric
condensate pressure line (0 bar g). Proceed
by drawing a line vertically upwards to meet
the 300 kg/h line on the upper half of the
chart.
Result: If the line is falling, choose the lower
size; if the line is rising, choose the larger
size.
150
100
80
65
50
40
32
25
20
15
10
6
40
30
20
10
5
2
1
0.5
0
Local regulations may restrict the use of this product to below the conditions quoted.
In the interests of development and improvement of the product, we reserve the right to change the specification without notice.
© Copyright 2007
S
t
e
a
m
t
e
m
p
e
r
a
t
u
r
e
°
C
S
t
e
a
m
s
y
s
t
e
m
p
r
e
s
s
u
r
e
b
a
r
g
C
o
n
d
e
n
s
a
t
e
f
l
o
w
r
a
t
e
k
g
/
h
C
o
n
d
e
n
s
a
t
e
p
i
p
e
s
i
z
e
m
m
C
o
n
d
e
n
s
a
t
e
s
y
s
t
e
m
p
r
e
s
s
u
r
e
b
a
r
g

