Steam traps
Manifolds and insulation jackets
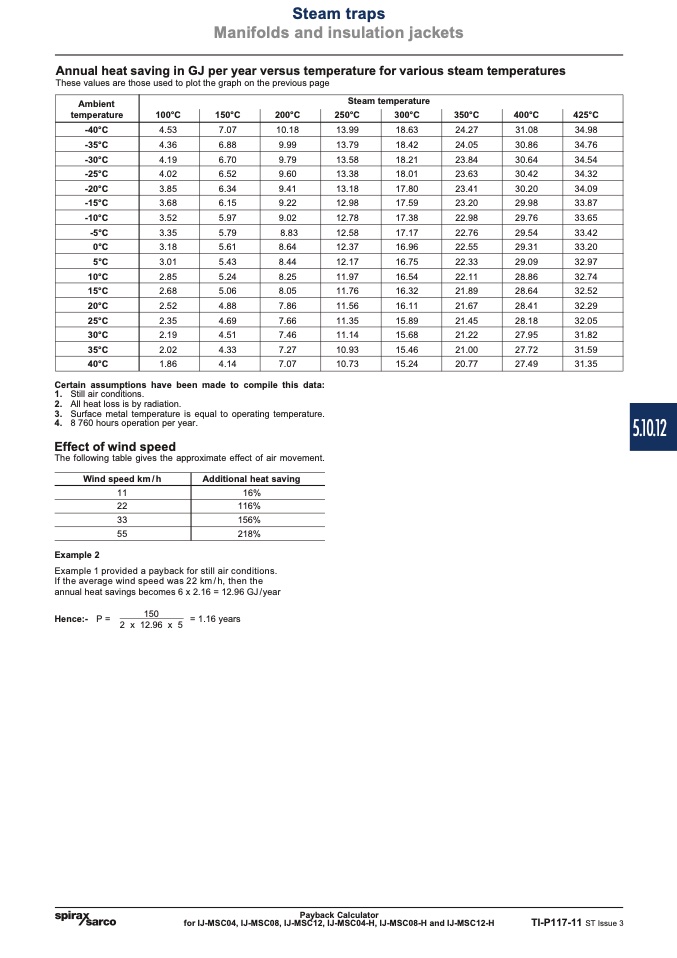
Annual heat saving in GJ per year versus temperature for various steam temperatures
These values are those used to plot the graph on the previous page
Ambient
temperature
Steam temperature
100°C
150°C
200°C
250°C
300°C
350°C
400°C
425°C
-40°C
4.53
7.07
10.18
13.99
18.63
24.27
31.08
34.98
-35°C
4.36
6.88
9.99
13.79
18.42
24.05
30.86
34.76
-30°C
4.19
6.70
9.79
13.58
18.21
23.84
30.64
34.54
-25°C
4.02
6.52
9.60
13.38
18.01
23.63
30.42
34.32
-20°C
3.85
6.34
9.41
13.18
17.80
23.41
30.20
34.09
-15°C
3.68
6.15
9.22
12.98
17.59
23.20
29.98
33.87
-10°C
3.52
5.97
9.02
12.78
17.38
22.98
29.76
33.65
-5°C
3.35
5.79
8.83
12.58
17.17
22.76
29.54
33.42
0°C
3.18
5.61
8.64
12.37
16.96
22.55
29.31
33.20
5°C
3.01
5.43
8.44
12.17
16.75
22.33
29.09
32.97
10°C
2.85
5.24
8.25
11.97
16.54
22.11
28.86
32.74
15°C
2.68
5.06
8.05
11.76
16.32
21.89
28.64
32.52
20°C
2.52
4.88
7.86
11.56
16.11
21.67
28.41
32.29
25°C
2.35
4.69
7.66
11.35
15.89
21.45
28.18
32.05
30°C
2.19
4.51
7.46
11.14
15.68
21.22
27.95
31.82
35°C
2.02
4.33
7.27
10.93
15.46
21.00
27.72
31.59
40°C
1.86
4.14
7.07
10.73
15.24
20.77
27.49
31.35
Certain assumptions have been made to compile this data:
1. Still air conditions.
2. All heat loss is by radiation.
3. Surface metal temperature is equal to operating temperature.
4. 8 760 hours operation per year.
Effect of wind speed
The following table gives the approximate effect of air movement.
Wind speed km / h
11
22
33
55
Additional heat saving
16%
116%
156%
218%
Example 2
Example 1 provided a payback for still air conditions.
If the average wind speed was 22 km / h, then the
annual heat savings becomes 6 x 2.16 = 12.96 GJ/year
Hence:- P =
150
= 1.16 years
2 x 12.96 x 5
Payback Calculator
for IJ-MSC04, IJ-MSC08, IJ-MSC12, IJ-MSC04-H, IJ-MSC08-H and IJ-MSC12-H
TI-P117-11 ST Issue 3
5.10.12

