Transparency in detail
Materials and material consumption
3.3 WHAT IS ACTUALLY
INSIDE A MORPH CHAIR?
3.4 MATERIAL CONSUMPTION
2017 TO 2020
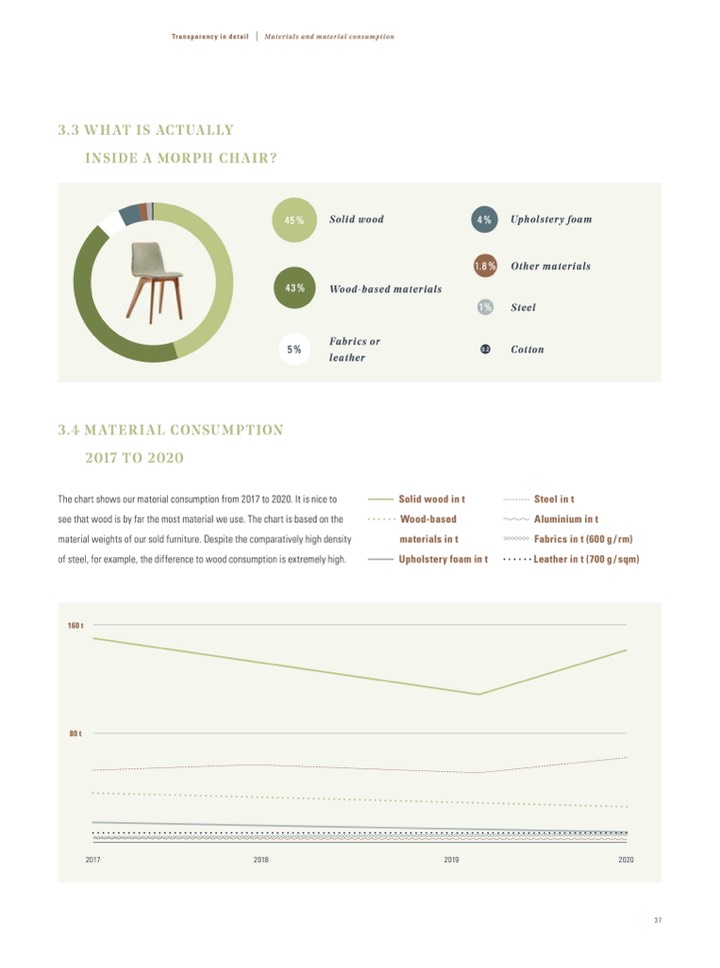
The chart shows our material consumption from 2017 to 2020. It is nice to
see that wood is by far the most material we use. The chart is based on the
material weights of our sold furniture. Despite the comparatively high density
of steel, for example, the difference to wood consumption is extremely high.
Solid wood in t
Wood-based
materials in t
Upholstery foam in t
Steel in t
Aluminium in t
Fabrics in t (600 g / rm)
Leather in t (700 g / sqm)
45%
Solid wood
43%
Wood-based materials
5%
Fabrics or
leather
4%
Upholstery foam
1.8%
Other materials
1%
Steel
0.2
Cotton
160t
80t
2017
2018
2019
2020
37

