PSI
BAR
1015
70
870
60
725
50
580
40
435
30
290
20
145
10
0
32
10
20
30
40
50
60
70
80
90
100
110
120
130
140
150 °C
68
104
140
176
212
248
284
302 °F
Y STRAINERS
TEC
DIAGRAM
PRESSURE-
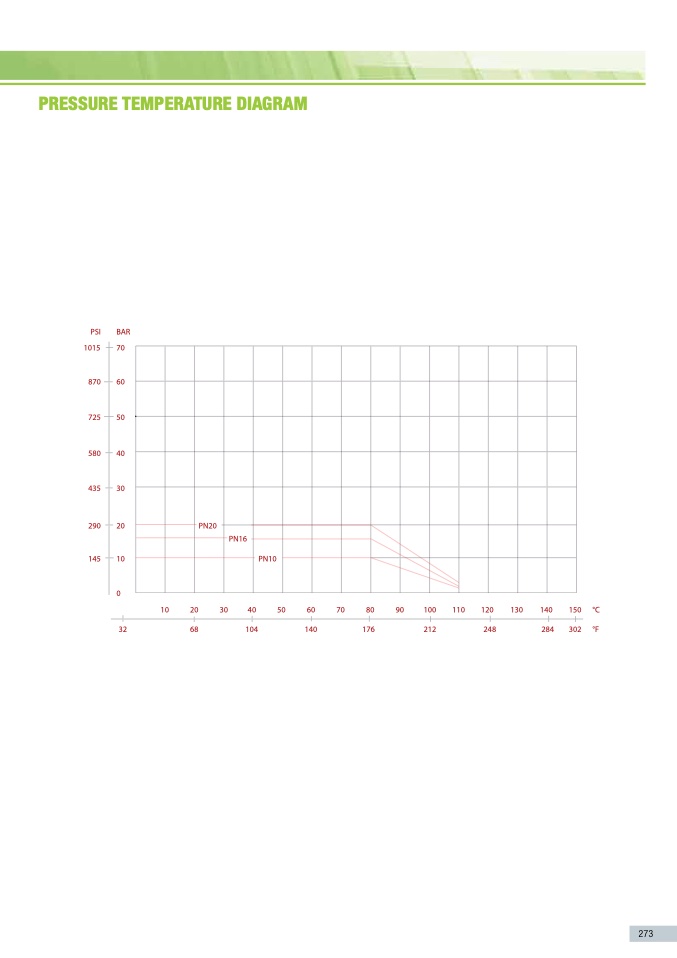
PRESSuRE TEmPERATuRE DIAGRAm
TEMPERATURE
PN20
PN16
PN10
The values shown by the dropping lines state the maximum limit of employment of the valves.
The shown valves are approximate.
273
S
T
R
A
I
N
E
R
S

